Impact of COVID-19 on Used Car Price in the Philippines

Infected ba ng COVID-1 and Kotse Natin?


Should I sell my car or should I not? Is this a good time to buy a 2nd hand car? 

Before COVID-19, these questions are already running in our minds. With the COVID-19 affecting every part of our lives, it is important to see if the used car market in the Philippines is also affected by this pandemic. CarSurvey.ph is in a unique position to give you the story on the effects of COVID-19 pandemic on the Used car Market price, comparing the before and after the Philippines' Enhanced Community Quarantine (ECQ) and the old normal prices back in 2019. 

Before we zoom in, it's good to have a perspective on the global market on automotive. In general, the outlook for the automotive industry is poor with an average decline of sales by ~20.7%. This is due to a disrupted supply chain and ultimately, low demand. With a lot of uncertainty in the business climate and in our own jobs, it is hard to think of buying a new car as there are more urgent matters that need our financial attention. 

World Automotive Market Statistics

[Source: Counterpoint]

This decline in demand for new cars is of course also observed in the Philippines. There is a steep decline of 51.1% of new vehicles sold compared to January to May for 2020 and 2019. 

Philippine Automotive Market Statistics

[Source: Philippine News Agency]

On the other hand, transportation is still an essential factor in everyone's lives, especially during the pandemic. As much as possible, we don't want to consider opting for public transportation due to the risk of getting infected. This is where the value of considering a 2nd hand car comes in. We think that buying a 2nd hand car is a balanced decision between satisfying our essential transportation needs and taking care of our budget. Let's see if this recommendation is also reflected in our used car market data and price trends. 

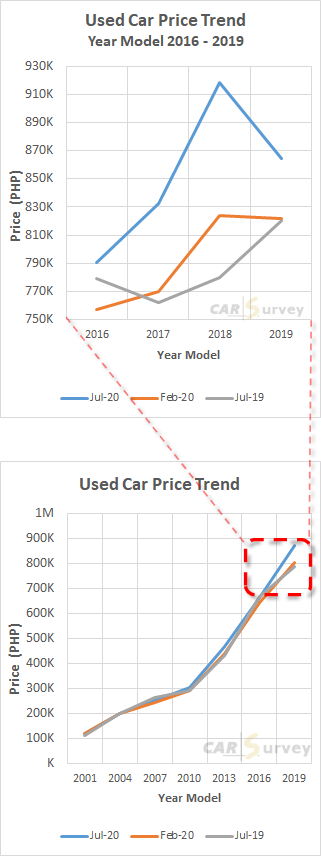
Below is the market price trend over different Year Model (NOTE: The Year Model is when the car was manufactured). Instead of just showing you a single number for the average selling price for all used cars in the market, it is more intuitive if you see the average selling price for each Year Model. We call this the price trend. We are showing three different snapshots of price trends, first is the price trend in July 2020, second is in February 2020 and the third is in July 2019. We think these are three significant price trends as July 2020 represents the time after the ECQ happened in the Philippines and establishments started opening again. The February 2020 price trend represents the trends before the ECQ and July 2019 represents the old normal. 
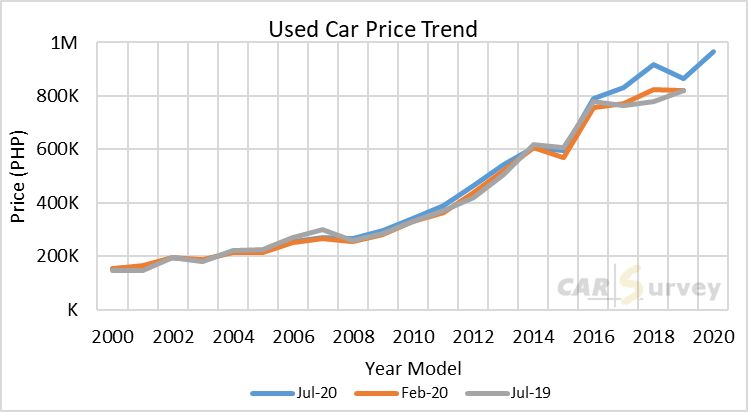
Used Car Price Trend in the Philippines

Used Car Price Trend in the Philippines

Click   here   to view the full graph
 

Just trusting your visual intuition, we can already sense that majority of the price trend had no significant change due to the pandemic except for the price of the cars that are relatively new, 3 years old, and newer. The average price increase for the younger cars from Feb 2020 to Jul 2020 is P66,657 and there is an even greater price increase if we compare it from July 2019 to July 2020 which is P84,341. We see that only the prices of the used car that was bought from 2017 to 2019 are affected by the pandemic .

Find out the market price of your car now! Use our FREE  

With this fact alone, you can leave us now bringing with you that conclusion. But there is more to unpack from these data. We are sure you are curious about why there is an increase in price for the younger cars in the used car market. 

Let's see if the supply or the number of cars being sold for that Year model will affect the Price trend. Below is the graph for the number of cars being sold cross the Year Model. If we look at the number of cars being sold for Year model from 2017 to 2019, there is almost the same number of cars being sold in the market for February 2020 and July 2020. In other words, the supply of cars for Year Model 2017 to 2019 stayed the same before and after ECQ. 

Used Car Supply Trend in the Philippines

Used Car Supply Trend in the Philippines

We now know that for the Year model 2017 to 2019, the price increased while the supply remained the same. We then turn to the Law of Supply and Demand to get our insight from this data. If the supply is fixed and the Price went up, we can infer that the Demand for cars with Year model from 2017 to 2019 increased.  

Law of Supply and Demand

Price Affected by Supply and Demand, [Source: Lumen]

Taking a step back and considering the decline in automotive sales in the Philippines, we can also connect that people who are supposed to be ready to get a brand new car is most likely going to the 2nd hand car market. These people still prefer good quality cars, an almost new quality, so the demand only affects the younger cars which are from 2017 to the 2019 year models. This reinforces our intuition earlier that considering the 2nd hand market is a good balance between satisfying our essential need for transportation and still within our budget. It also adds that to achieve an almost new quality, choose the younger 2nd hand cars. 

The story above may already be complete for you but CarSurvey.ph provides you more than visual interpretations, we also give you statistical conclusion that will further provide concreteness in your intuition. 

First to ask is, where do we base these graphs. For this, we look to the model on how our Philippines Stock Exchange does it. In the stock market, to get the sense of the pulse of the market, we don't get the average of all the available stocks, instead, what we do is we only consider the top-performing company and the resulting value would be our PSEI or Philippines Stock Exchange Index. For decades, our country and the rest of the world are using an Index to get a sense of the trends of that particular market. 

In the same way, CarSurvey.ph created an index to provide a reliable price trend for the used car market in the Philippines. This index is composed of the top 10 most sold cars in the Philippines today. With these 10 car models alone, they already cover 36% of our whole database. We then spread their average price according to the Year Model and the resulting graphs are our price trend graph. The top 10 models are listed below and you can read more about these models here

1. Toyota Vios

2. Honda Civic

3. Toyota Innova

4. Toyota Fortuner

5. Toyota Corolla

    6. Honda City

    7. Honda CR-V

    8. Mitsubishi Montero Sport

    9. Mitsubishi Adventure

    10. Toyota Hi-Ace

Going back to our visual intuition from the price trend graph, it is also important to have a statistical way for us to determine if two sets of data are indeed similar or not. This question is very important to answer when it comes to developing a drug. For this pandemic, The World Health Organization (WHO) has this program called Solidarity Trial where they determine which drug is effective in treating COVID-19.For this kind of situation, the  t test  is one of the statistical tools that help provide a concrete conclusion if a certain set of data made a significant change in the previous data.

Experiments and Statistics

We ran the t test analysis on our data sets and the results are shown in the table below.
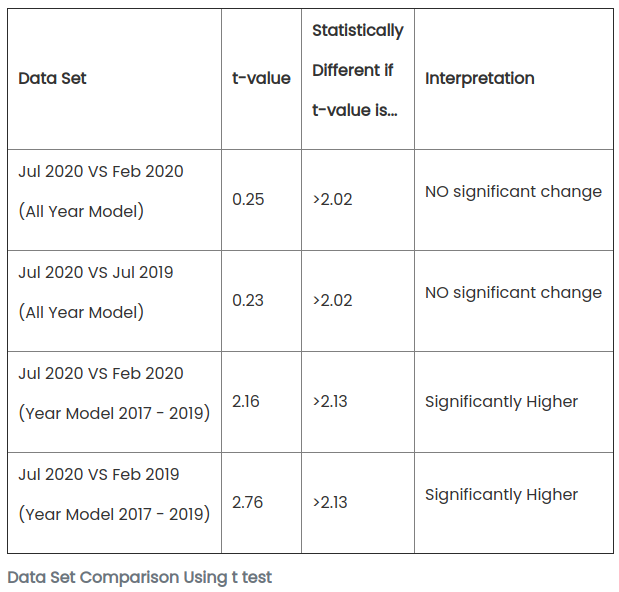
Data Set Comparison Using t test

Data Set Comparison Using t test
Data Set t-value

Statistically

Different if

t-value is...

Interpretation

Jul 2020 VS Feb 2020

(All Year Model)

0.25 >2.02

NO significant change

Jul 2020 VS Jul 2019

(All Year Model)

0.23 >2.02

NO significant change

Jul 2020 VS Feb 2020

(Year Model 2017 - 2019)

2.16 >2.13 Significantly Higher

Jul 2020 VS Feb 2019

(Year Model 2017 - 2019)

2.76 >2.13

Significantly Higher

From this analysis, when we look at the whole data, we can statistically conclude that there is no significant price change from all three data sets. But if we only consider the Year Model from 2017 up to 2019, we can statistically conclude that there is a significant increase in used car prices in July 2020 compared to either February 2020 or July 2019. To further prove the point, the t test analysis also computed that this conclusion is consistent by 95.17% (greater than 95% is considered accurate).

This might be a long and winded way of arriving at the same conclusion but we pride ourselves on the integrity and concreteness of our analysis. We hope you also appreciate the statistical conclusion together with the visual intuition that we provided.  

Final Sunset Photo

So what does this mean to you? If you are buying a second-hand car, please be prepared for an increased price for the younger cars. If you still want to be within your budget, try to consider cars that are from 2016 and older. Those car prices are not affected by the pandemic. If you are selling cars and you have a young car, have the confidence to put a premium on your car as you already know that the demand for that car is high after the ECQ. Whether you are buying or selling cars, make sure you use our  online car appraisal tool. This will equip you with the current market price of the car you are trying to sell or buy. 

Good luck and stay safe! 

What's next? Find out the market price of your car now!  

[Photo Credit:   wlos.com]


Let's have a conversation. Please LIKE our FB Page.
Share this story via:

Second Hand Toyota Innova - Dependable Car and Price Trend

Toyota Innova is the third most sold car in the 2nd hand car market but i is the number one in its class of compact MPV. Toyota Innova has been in the market for quite some time already and it has an impression of a very dependable car. May it be for a whole family or for a bunch of friends, with its spacious cabin and strong engine, you can really depend on this car to take you where you want to go. Fortunately, its 2nd hand price statistics are also dependable throughout the years, let's what we mean about that 

Toyota Innova

Toyota Innova [Photo Credit: Nathanferdinand]

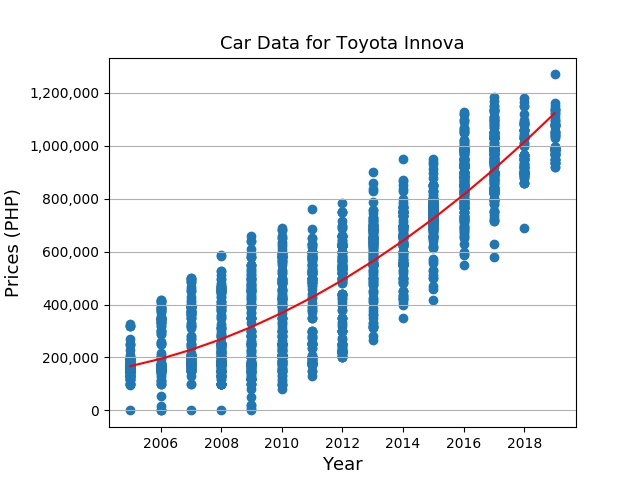
The image below is the price of the 2nd hand Innova in the 2nd hand market As expected, the price of the Toyota Innova is dependably going down as the age of the car goes higher. There is a statistical term that measures the relationship between two factors and this is called correlation. The correlation can have values ranging from -1 to +1. The correlation of the price of the Toyota Innova to its age is -0.985. This highly negative correlation coincides with our intuition and the price graph below that the price of the Toyota Innova is going down as the age of the car goes up.

Second Hand Toyota Innova Price Trend

 
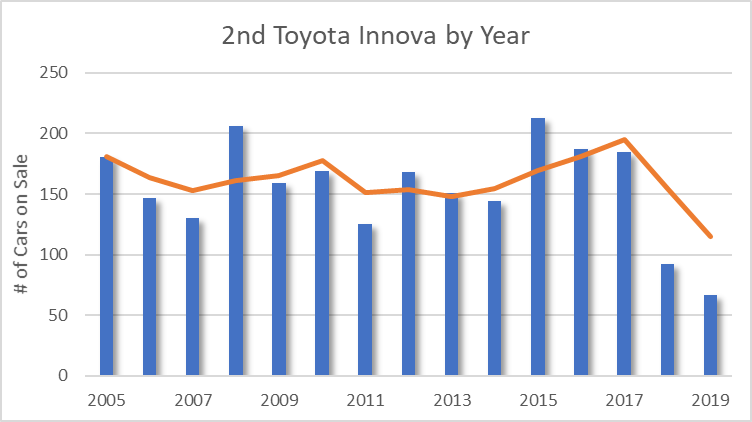
Another interesting to look at for the Toyota Innova is the number of cars on the market according to the year it was bought. We have that graph shown below. We can easily notice that there is a similar number of cars that are spread throughout the years. This means that even the old car for Toyota Innova can still be sold and still be attractive to the market. This is because most of the sellers bring down the price to an acceptable value. To know this acceptable value, our car value calculator made use of the data in these graphs and the correlation of the price and age to tell you the acceptable price. This should give you more confidence to sell your car at that price because other people are selling at that price as well.
 

Toyota Innova On Sale by Year

 
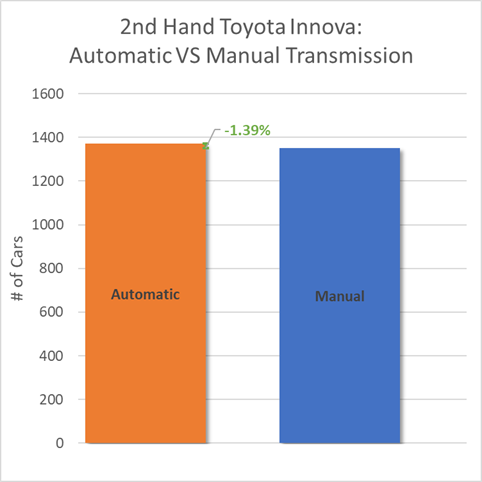
We were also curious if there are more Toyota Innova on sale that has an automatic transmission or manual transmission. We graph this data in the figure below and it turns out that there is almost an equal number of Toyota Innova that has an automatic and manual transmission.

Toyota Innova Automatic VS Manual

 
Because of these data, we really think that the Toyota Price statistics are very dependable. If you want to buy a relatively new Toyota Innova model, you have to pay for a bit higher price. The same goes with an older model, you will enjoy a cheaper price. You will also not have a hard problem finding Toyota Innova that is on sale for different age of the car, they are abundant in the market. You can also readily pick if you like a manual transmission o an automatic transmission. You can rest your mind easily with this car model.


Let's have a conversation. Please LIKE our FB Page.
Share this story via:

Second Hand Car Honda Civic - Looks Equals the Price

The Honda Civic is the second part of our series of digging deep on the data of our Top 10 2nd hand cars in the Philippines. Honda Civic happens to be the 2nd place as well in our ranking  Unlike our top car, Toyota Vios, which we considered as every man's car, Honda Civic has been perceived as a notch higher than the Toyota Vios in terms of its classiness and consequently, its price is a bit higher as well. Let's see the difference in the behavior of the data when the car is a bit higher in class 

First, we'd like to check the price trend for the Honda Civic the graph for this is shown below. We showed here the price trend of the Hond Civic from 2011 when they released the ninth generation of the Honda Civic up to the recent year. We'd like to start there because the generation of this model affects the resale value of this car. 

Second Hand Honda Civic Price Trend

From 2011 up to 2014, there is a weird correlation between the age of the care to its average resale price. It could mean that the market treats the ninth-generation Honda Civic model as having the same re-sale price from 2011 to 2015 which is when the model is out in the market 

But when the tenth generation came in 2015, we think that this is a major facelift to the Honda Civic car model. It was slick and very sporty. We can also see that the resale price of this tenth generation Honda Civic model has started to increase with a steep slope. 

Unlike the Toyota Vios, there is a massive change in the look of the Honda Civic from the last two decades. You can see below the Honda Civic from the early 2000s and the very sporty Honda Civic car from recent years 

Honda Civic Old

2002 Honda Civic [Photo Credit: Alex Neman]

Honda Civic Old

2002 Honda Civic [Photo Credit: Rutger van der Maar]

If we look at the Honda Cars on the 2nd hand market according to the age of the car starting from about two decades ago, we can see that bulk of the cars being sold in the market are almost a decade old. The Honda Civic car owners are mostly keeping their cars for themselves, unlike the Toyota Vios where people are starting to sell their car within the 5 years. 

Second Hand Honda Civic Price Trend VS Years

Another interesting characteristic of the Honda Civic cars on sale in the 2nd hand market is that the models mostly have Automatic Transmission. Below is the graph of the 2nd Hand Honda Civic model according to its transmission. The amount of Honda Civic that has automatic transmission is more than double the Honda Civic with manual transmission. Compared that to the Toyota Vios where there are a similar number of cars that has automatic and manual transmission type.
 

Second Hand Honda Civic Transmission Type
With these data, we saw some unique characteristics of the Honda Civic that sets it apart from an everyday car like Toyota Vios. First is that this car model has put more effort into doing major facelift to the look of its car. Second is that the car owners of this model are more clingy to the Honda Civic that they bought. The last one would be, as we expect for a more pricy model car, most of these are using an automatic transmission. 


Let's have a conversation. Please LIKE our FB Page.
Share this story via:

Second Hand Toyota Vios - Current Price and Statistics

Being the number one in the top 10 2nd hand cars in the market comes with certain beliefs and expectations with it. What we'd like to say at the very start is that the Toyota Vios did not disappoint from these expectations. Let's look at the data of the current Toyota Vios in the second-hand car market to see what we mean.

When it comes to price, it is intuitive to say that as the age of the car gets older, the price of the car decreases. Below is the data on the prices of the Toyota Vios spread through the years. From 2013 up to recent years, this is pretty consistent with our intuition that the Toyota Vios model prices decrease as the age of the car increases. You'll be surprised that some car models do not have this very close relationship with the price and the age of the car. 

Second Hand Toyota Price Trend

In statistics, there is actually a term that concretely describes this intuition and this is the correlation. When we said that as the age of the car increases, the price of the car decreases, we are also saying that there is a negative correlation between the age of the car and the price of the car. A correlation can have a maximum value of 1, which we also call a positive correlation. Then it can also have a minimum value of -1 which corresponds to the negative correlation. For the Toyota Vios model, the correlation is -.987. This highly negative correlation number conforms with the visualization of the data and our own initial intuition. 

One of the reasons why the price of a second hand har deviates from the expected relationship with its age of the car is a major facelift on the look of the car model. For the Toyota Vios, we think that in the past two decades, there is not much change in the looks of the Toyota Vios. Below is the Toyota Vios in the early 2000s and then compare it with recent models. There is really not much difference and maybe that is the strategy of the Toyota car maker. 

Toyota Vios Old

2003 - 2005 Toyota Vios [Photo Credit to Mike384]

Toyota Vios New Model

2019 Toyota Vios [Photo Credit to Celica21gtfour]

Another angle that is important to look at is how many Toyota Vios is being sold in the market according to its age. This car model has a long tail where we can see that there are still a significant amount of cars being sold even at the age of 17 years for a car. The bulk of the cars being sold in the market are still cars that are below 5 years of age in the car. With the Toyota Vios not having a major facelift in the past two decades, maybe it contributed to the fact that more cars are still being sold even at an older age. This can have a positive effect when you are a seller of the car. Think about it, if our 10-year-old car is still at the top of its shape and it looks like your newer 5-year old car, then maybe our car will just beat you in selling in the market because our car is much cheaper than yours.

Toyota Vios Price Volume Over The Years

With all of these data for the Toyota Vios model, this leaves us with the impression that Toyota Vios is a dependable and predictable car. It has been consistent in the past decades and maybe this is the main reason why Toyota Vios is the most sold cars in the second-hand market for today.


Let's have a conversation. Please LIKE our FB Page.
Share this story via:

Interactive Map for the Registered Motor Vehicle in LTO

In continuation from this article, below is the distribution of registered motor vehicles represented by the intensity of colors. You can see that there is not a fair distribution of car owners in the Philippines. Most of them are in Metro Manila and the regions around it. Have fun playing around with the map!

LTO motor vehicle heat map Philippines

Distribution of Register Motor Vehicles across the Philippine Regions
Hover or click on the regions to see the number of regsitered motor vehicles. [Only available in desktop view]


Let's have a conversation. Please LIKE our FB Page.
Share this story via: