
Should I sell my car or should I not? Is this a good time to buy a 2nd hand car?
Before COVID-19, these questions are already running in our minds. With the COVID-19 affecting every part of our lives, it is important to see if the used car market in the Philippines is also affected by this pandemic. CarSurvey.ph is in a unique position to give you the story on the effects of COVID-19 pandemic on the Used car Market price, comparing the before and after the Philippines' Enhanced Community Quarantine (ECQ) and the old normal prices back in 2019.
Before we zoom in, it's good to have a perspective on the global market on automotive. In general, the outlook for the automotive industry is poor with an average decline of sales by ~20.7%. This is due to a disrupted supply chain and ultimately, low demand. With a lot of uncertainty in the business climate and in our own jobs, it is hard to think of buying a new car as there are more urgent matters that need our financial attention.

[Source: Counterpoint]
This decline in demand for new cars is of course also observed in the Philippines. There is a steep decline of 51.1% of new vehicles sold compared to January to May for 2020 and 2019.

[Source: Philippine News Agency]
On the other hand, transportation is still an essential factor in everyone's lives, especially during the pandemic. As much as possible, we don't want to consider opting for public transportation due to the risk of getting infected. This is where the value of considering a 2nd hand car comes in. We think that buying a 2nd hand car is a balanced decision between satisfying our essential transportation needs and taking care of our budget. Let's see if this recommendation is also reflected in our used car market data and price trends.
Below is the market price trend over different Year Model (NOTE: The Year Model is when the car was manufactured). Instead of just showing you a single number for the average selling price for all used cars in the market, it is more intuitive if you see the average selling price for each Year Model. We call this the price trend. We are showing three different snapshots of price trends, first is the price trend in July 2020, second is in February 2020 and the third is in July 2019. We think these are three significant price trends as July 2020 represents the time after the ECQ happened in the Philippines and establishments started opening again. The February 2020 price trend represents the trends before the ECQ and July 2019 represents the old normal.
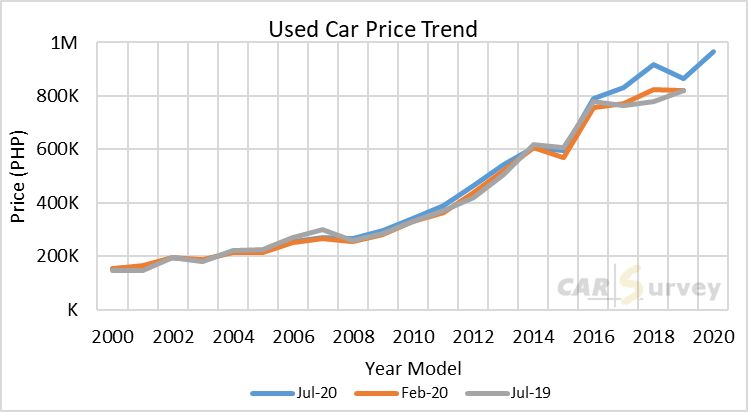
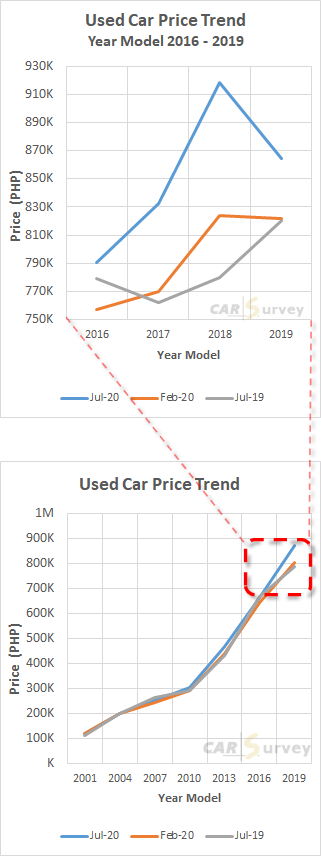
Just trusting your visual intuition, we can already sense that majority of the price trend had no significant change due to the pandemic except for the price of the cars that are relatively new, 3 years old, and newer. The average price increase for the younger cars from Feb 2020 to Jul 2020 is P66,657 and there is an even greater price increase if we compare it from July 2019 to July 2020 which is P84,341. We see that only the prices of the used car that was bought from 2017 to 2019 are affected by the pandemic .
With this fact alone, you can leave us now bringing with you that conclusion. But there is more to unpack from these data. We are sure you are curious about why there is an increase in price for the younger cars in the used car market.
Let's see if the?supply?or the number of cars being sold for that Year model will affect the Price trend. Below is the graph for the number of cars being sold cross the Year Model. If we look at the number of cars being sold for Year model from 2017 to 2019, there is almost the same number of cars being sold in the market for February 2020 and July 2020. In other words, the supply of cars for Year Model 2017 to 2019 stayed the same before and after ECQ.


We now know that for the Year model 2017 to 2019, the price increased while the supply remained the same. We then turn to the Law of Supply and Demand to get our insight from this data. If the supply is fixed and the Price went up, we can infer that the Demand for cars with Year model from 2017 to 2019 increased.?

Price Affected by Supply and Demand, [Source: Lumen]
Taking a step back and considering the decline in automotive sales in the Philippines, we can also connect that people who are supposed to be ready to get a brand new car is most likely going to the 2nd hand car market. These people still prefer good quality cars, an almost new quality, so the demand only affects the younger cars which are from 2017 to the 2019 year models. This reinforces our intuition earlier that considering the 2nd hand market is a good balance between satisfying our essential need for transportation and still within our budget. It also adds that to achieve an almost new quality, choose the younger 2nd hand cars.
The story above may already be complete for you but CarSurvey.ph provides you more than visual interpretations, we also give you statistical conclusion that will further provide concreteness in your intuition.
First to ask is, where do we base these graphs. For this, we look to the model on how our Philippines Stock Exchange does it. In the stock market, to get the sense of the pulse of the market, we don't get the average of all the available stocks, instead, what we do is we only consider the top-performing company and the resulting value would be our PSEI or Philippines Stock Exchange Index. For decades, our country and the rest of the world are using an Index to get a sense of the trends of that particular market.
In the same way, CarSurvey.ph created an index to provide a reliable price trend for the used car market in the Philippines. This index is composed of the top 10 most sold cars in the Philippines today. With these 10 car models alone, they already cover 36% of our whole database. We then spread their average price according to the Year Model and the resulting graphs are our price trend graph. The top 10 models are listed below and you can read more about these models here.
|
1. Toyota Vios 2. Honda Civic 3. Toyota Innova 4. Toyota Fortuner 5. Toyota Corolla |
6. Honda City 7. Honda CR-V 8. Mitsubishi Montero Sport 9. Mitsubishi Adventure 10. Toyota Hi-Ace |
Going back to our visual intuition from the price trend graph, it is also important to have a statistical way for us to determine if two sets of data are indeed similar or not. This question is very important to answer when it comes to developing a drug. For this pandemic, The World Health Organization (WHO) has this program called Solidarity Trial where they determine which drug is effective in treating COVID-19.For this kind of situation, the ?t test? is one of the statistical tools that help provide a concrete conclusion if a certain set of data made a significant change in the previous data.

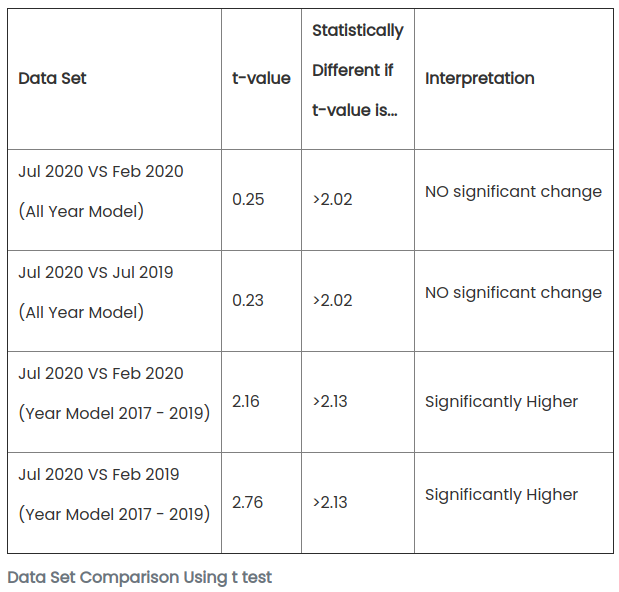
We ran the t test analysis on our data sets and the results are shown in the table below.
| Data Set | t-value |
Statistically Different if t-value is... |
Interpretation |
|---|---|---|---|
|
Jul 2020 VS Feb 2020 (All Year Model) |
0.25 | >2.02 |
NO significant change |
|
Jul 2020 VS Jul 2019 (All Year Model) |
0.23 | >2.02 |
NO significant change |
|
Jul 2020 VS Feb 2020 (Year Model 2017 - 2019) |
2.16 | >2.13 | Significantly Higher |
|
Jul 2020 VS Feb 2019 (Year Model 2017 - 2019) |
2.76 | >2.13 |
Significantly Higher |
From this analysis, when we look at the whole data, we can statistically conclude that there is no significant price change from all three data sets. But if we only consider the Year Model from 2017 up to 2019, we can statistically conclude that there is a significant increase in used car prices in July 2020 compared to either February 2020 or July 2019. To further prove the point, the t test analysis also computed that this conclusion is consistent by 95.17% (greater than 95% is considered accurate).
This might be a long and winded way of arriving at the same conclusion but we pride ourselves on the integrity and concreteness of our analysis. We hope you also appreciate the statistical conclusion together with the visual intuition that we provided.?

So what does this mean to you? If you are buying a second-hand car, please be prepared for an increased price for the younger cars. If you still want to be within your budget, try to consider cars that are from 2016 and older. Those car prices are not affected by the pandemic. If you are selling cars and you have a young car, have the confidence to put a premium on your car as you already know that the demand for that car is high after the ECQ. Whether you are buying or selling cars, make sure you use our online car appraisal tool. This will equip you with the current market price of the car you are trying to sell or buy.
Good luck and stay safe!
[Photo Credit: wlos.com]